
Dramatic perhaps but the truth is if you are unfamiliar with or don’t have an understanding of chart datum the outcome could be an unhappy one.
 |
| Looks like the chart datum was wrong for plotting satellite positions on. |
 |
| While not a paper style chart this satellite photo chart is referenced to WGS 84 datum, the paper style chart can be seen poking out from under the satellite photo chart at the top.. |
 |
| I have used this screen shot to display the anchorage waypoints (referenced to WGS 84) displayed on a chart that is not referenced to WGS 84 |
We met up with a cruiser who had passed us a couple of anchorages that were nothing like he reported position depth and bottom. He was shocked to hear we had problems with the anchorages. We were now anchored about 40 metres apart and exchanged coordinates of our positions in the bay now. The expected out-come should have been thirty or forty metres apart as we were anchored behind one another, but the reality was that it was a substantial miss tie. So began the search for the discrepancy and as it turned out he didn't have a chartplotter and was using older paper charts and had his GPS receiver on the same datum as his charts. When he read off positions to pass on to others they should not have been plotted on a chartplotter or newer charts. He forgot to pass along the info that he was using an older datum not WGS84. We even know of others that use paper charts with a datum of unknown origin and use an external GPS to guess-ti-mate where they are on the chart.
 |
| Look at the same anchorage waypoints on a satellite photo chart referenced to WGS 84, now there are some with no protection and are very exposed and one is high and dry. |
Chart Datum
Datum; confusing it can be, and the source of the confusion starts with the type of datum. A datum is defined as any numerical or geometrical quantity or set of such quantities which serves as a reference point for other measurements.
In cartography and marine navigation charts two types of datum must be considered: a horizontal datum and a vertical datum. The horizontal datum forms the basis for computations of horizontal position, in simple terms “where your at on the chart” lat and long. The vertical datum provides the reference for measuring heights and depths. Again simply put, a standard base measurement so we know how deep the water is at high tide or how much clearance there will be going under that bridge.
Horizontal Datum
Geodetic Datum is used in geodesy, navigation, surveying, cartography and satellite navigation systems to translate positions indicated on charts (paper or digital) to their real position on Earth.
Positioning systems, I will narrow that down to satellite positioning system datum (geodetic datum) and the chart on which that position is being displayed, need to match. If they don’t match, a hazard that you believe has been given sufficient clearance could well be about to take a chunk out of your keel. Similarly, the harbour entrance you believe you are approaching in a thick fog may actually be the break water wall not where you really want your vessel to be pointed.
Knowing and understanding about the geodetic datum your GPS is using to calculate positions and the geodetic datum your chart has been modelled on can be the difference between a happy day out or one that may just end in tears.
The latitude and longitude of places on a chart whether electronic or paper, depend on what mathematical model is used to represent the Earth. The challenge is that the Earth is an ellipsoidal, 3-dimensional surface, while the chart or map is a flat, 2-dimensional surface.
A three dimensional surface, I always remember when I was in school the teacher would hold up the globe and pronounce to the class with the utmost authority the world was a perfectly round sphere just like a ball.
 |
| Exaggerated shape perhaps, however not a perfectly round smooth ball. I hope the drawing gives an idea how the real shape of the earth comes about. |
Well our old teacher may have been partly correct, it may be like a ball but not the perfectly round sphere she was trying to make us believe it was. The real earth shape as it turns out it is more like a soccer ball that the big kids had been kicking around the school yard every recess time since forever. Yep flat spots, bulges and its starting to get flat spots on the top and bottom so it’s now more elliptical.
All charts, whether paper or electronic, are represented as a mathematical model of the Earth. However, and as we know the shape of the Earth is not a perfect round and smooth sphere, so a mathematical model optimised for one country or continent may not suit another. For example the geodetic datum used for mapping the south pacific or Australia will certainly be different to the model used when mapping the Himalayas with all those hills and mountains.
 |
| While the heights above the WGS 84 Ellipsoid are exaggerated I hope to just give an idea of how the datum may look in the real world. |
Different mathematical model shapes are/were therefore used for mapping different areas of the earth. Within this variation, geodetic datum used for mapping individual countries usually will evolve over time due to new techniques and equipment. There will be differences between old and new charts if a new geodetic datum has been used during the production of the chart. Beware of charts produced with different datum’s in areas where they overlap. You will not be able to transfer a position to the next chart unless the position is converted to match the new chart datum.
Once satellite positioning systems evolved a geodetic datum was needed to encompass the whole world, not just small sections. The model had to make the satellite received positions be within a few metres on the real world soccer ball.
The latest geodetic datum WGS84, is a mathematical model of the Earth intended as a compromise that idealistically represents the world for hands-on satellite navigation purposes. Yes there were earlier versions, WGS 66 WGS 72 and now WGS 84. You should find all of the latest commercial marine electronic charts are produced to use WGS 84. Like any chart whether paper or electronic they are not always totally accurate in every location. Even with electronic charts you are still required to do secondary checks to confirm your position on the chart, not many people do but its a worthwhile exercise. Especially when moving into a new area.
 |
| In red the smooth calculated Ellipsoid that is used to smooth out the earths real shape. |
In Australia all ENC (Electronic Navigation Charts) and paper nautical charts published by the AHS (Australian Hydrographic Service) are compiled on WGS84 (World Geodetic Spheroid 1984) in accordance with international specifications. www.hydro.gov.au
 |
| Fairly standard Australian chart text box stating what Datum the chart maker has used. |
However, not all other nation’s paper charts have been modernised to this international standard. Unfortunately, some of the older local datum (of various vintages) may have carried over from the original paper charts then into the apparently modern electronic ones when they were digitised. The differences can occasionally be as much as several hundred metres. If in doubt, always check your position by range and bearings to charted features.
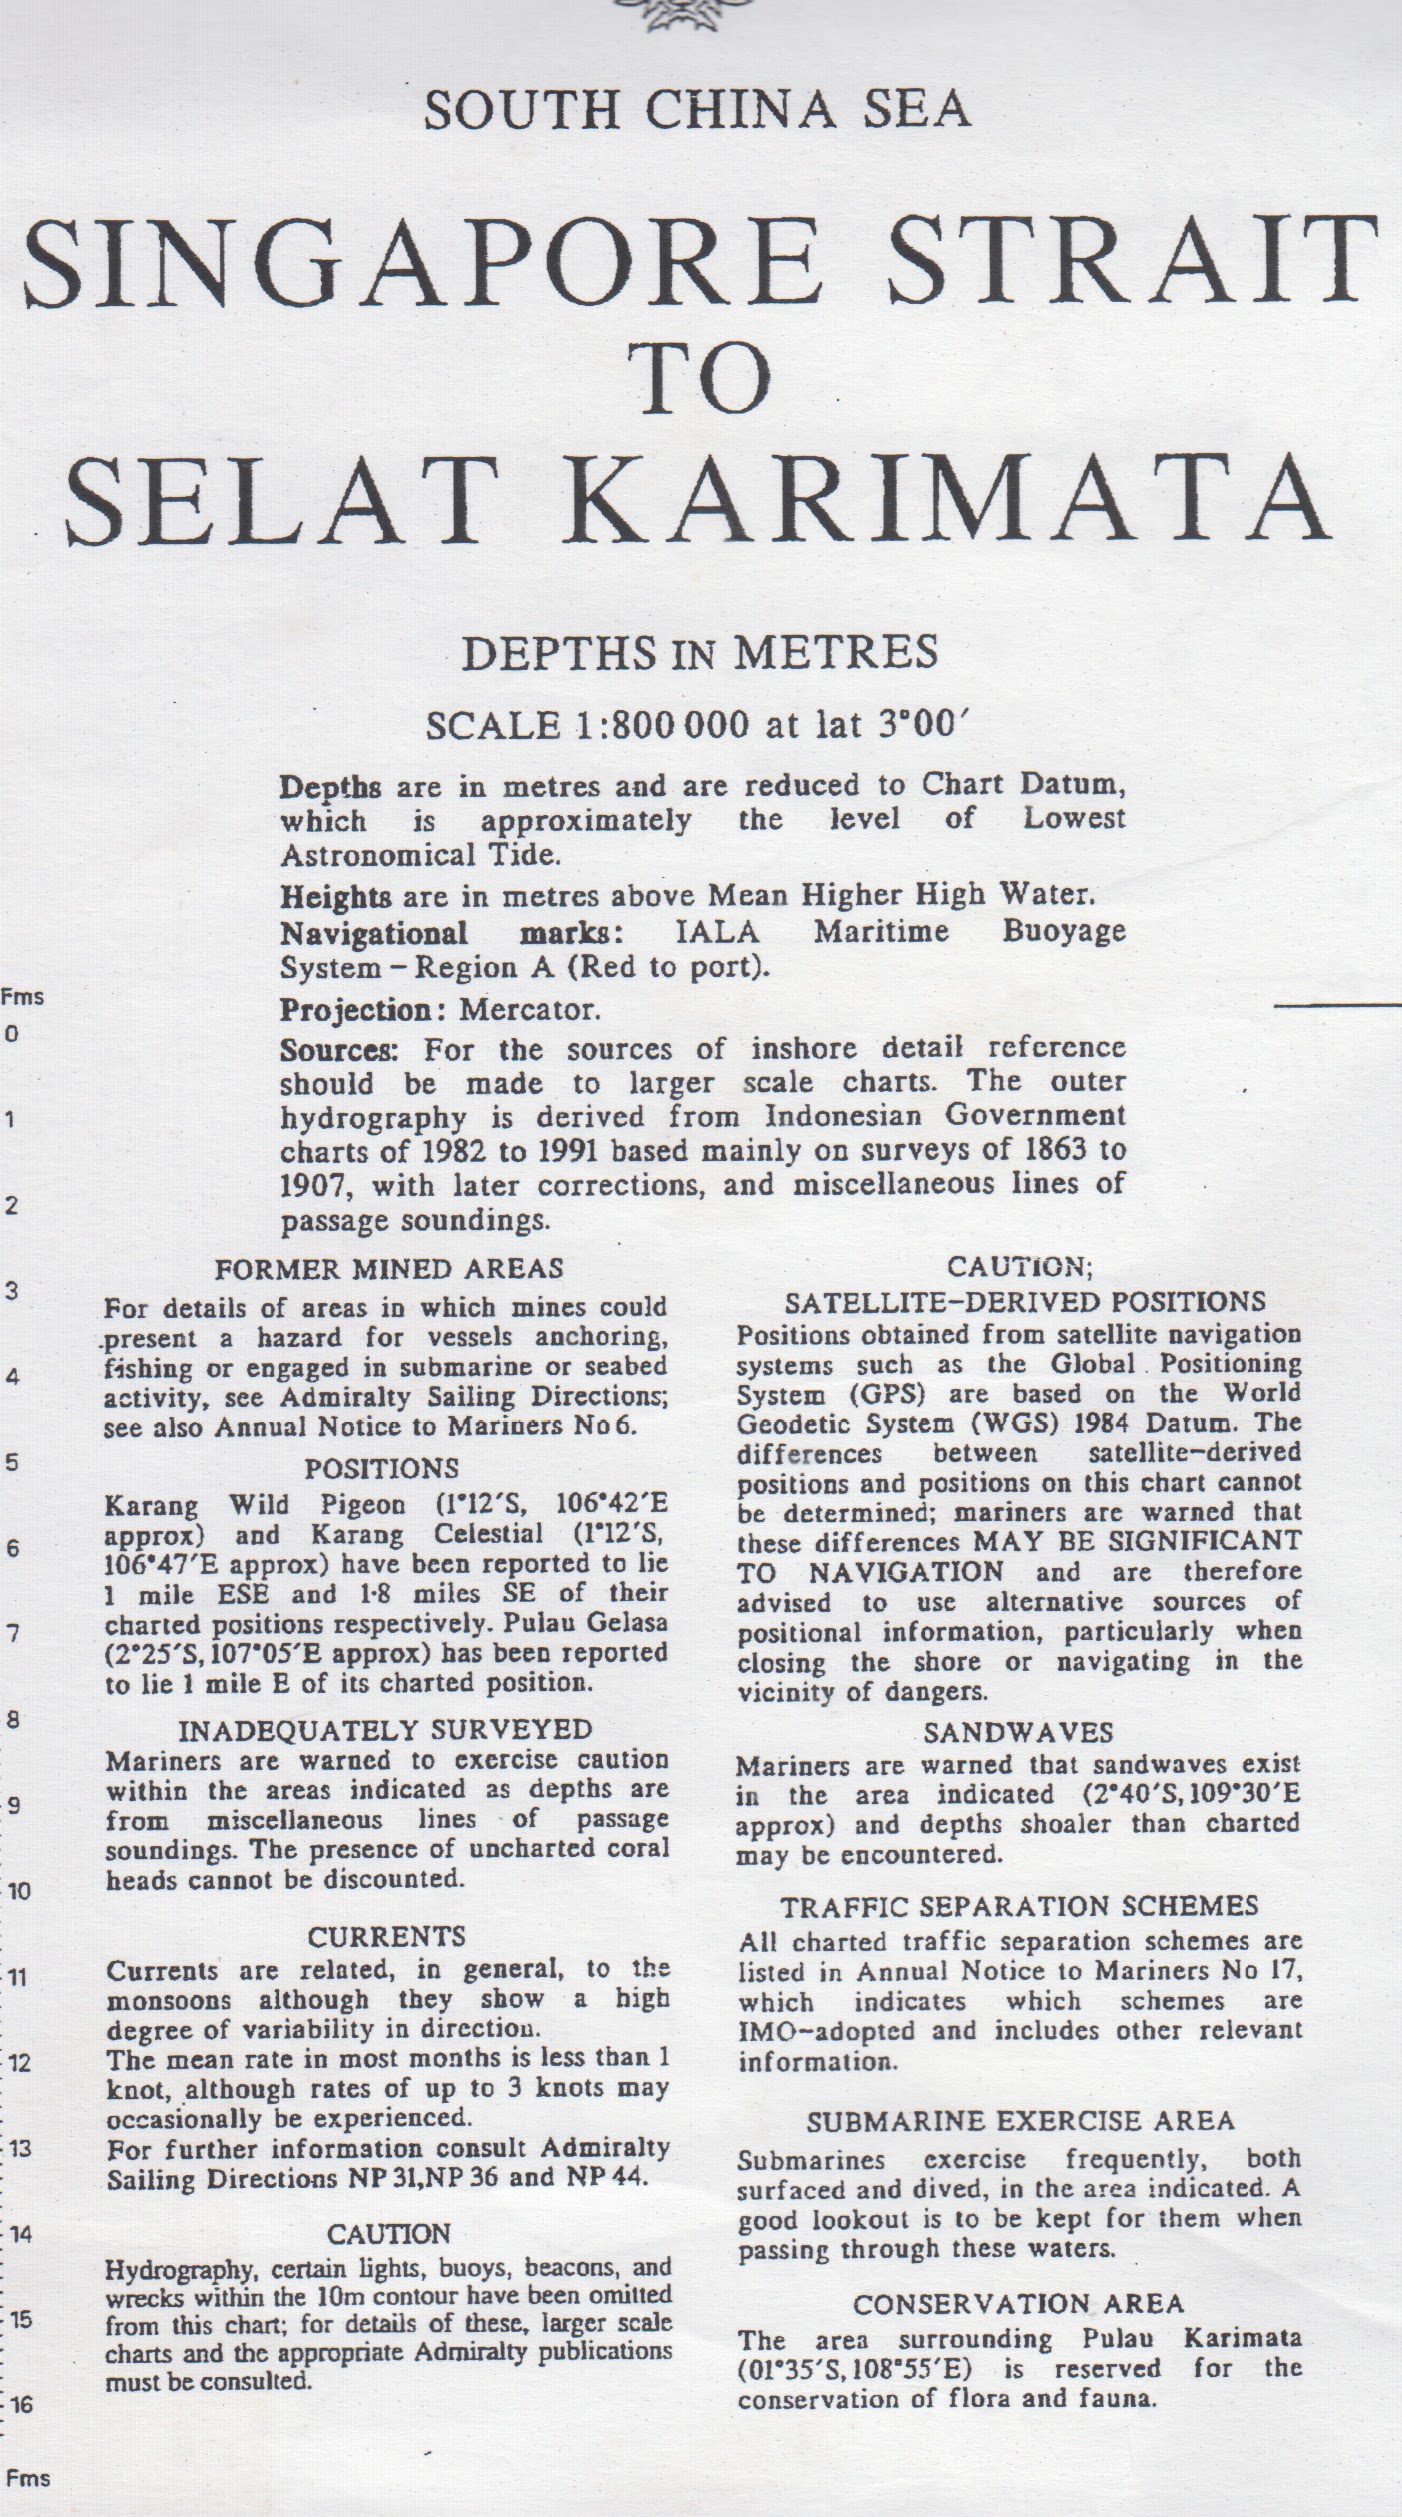 |
| While its listed satellite positions cannot be plotted on this chart, we felt reference for chart Datum was ambiguous, it mentions surveys, but there is no mention of the Datum used in the surveys. The Position warning here in the text box stating the Karang's (Bahasa for Reefs) being reported out of place turned up on a commercial electronic chart in the positions listed and didn't have a warning attached in the chart layers to explain the possible mis placed reefs. |
 |
| The electronic chart with the out of place reefs as noted in the paper chart text box. No such warnings listed on the electronic chart and these are plotted in the same position as the paper chart that cannot be referenced to WGS 84. So I would have a guess and say the electronic chart info was taken directly from the old paper chart that had no detail of datum listed. |
Your satellite positioning system should be set to give positions referenced to WGS84 when using any official electronic or paper nautical chart that have the Satellite Derived Positions reference box stating that WGS84 positions can be plotted directly on this chart. WGS84 is typically the default datum used in most satellite positioning receivers. However in Australia if you are using older charts and the geodetic datum of the charts is AGD66 then you can select this geodetic datum in your GPS receiver and plot positions on the chart. However you need to confirm your GPS receiver is really changing the geodetic datum correctly. Tie up at a known point on the chart and or do several range and bearing sights (with RADAR works) to known chart objects. Keep in mind older charts can contain charted features that may no longer exist or have been rebuilt in another location.
Satellite receiver’s datum settings
CHECK YOUR SATELLITE RECEIVER GEODETIC DATUM SETTINGS CAREFULLY – as I have written earlier all latitudes and longitudes which you use for navigation must relate to the same datum. It is worthwhile to check your GPS receiver before the start of a passage or a day out. Make sure the selected geodetic datum match the charts you’re using, as I said previously the manufactures of ENC’s use WGS84 as a standard, and paper charts are as marked. If your using a tablet or smart phone for navigation, there is no way I know of to check the datum used, WGS84 should be the default if there isn't others to select from.
 |
| Example settings screen showing that WGS 84 has been selected as Map Datum, not all receivers have this feature of additional datum to select. |
While this may sound crazy I’ve had a GPS receiver that had a fault and in several instances did change the geodetic datum all on its own somewhere during a passage. I sent the receiver back to the manufactures a couple of times. Then after the fourth of fifth time rather than risk having a faulty receiver I put it in the bin. At the time I was lucky to be operating in an area with a lot of beacons. With a change of datum I found the beacons were a lot closer or further away than I would expect to find them and the first time it took me a while to work out why all the beacons were now in the middle of the channel. It’s a good thing I wasn’t trying to pass through an unmarked murky reef area.
Importantly if your vessel has been tied up for a couple of weeks, has suffered a power failure or has undergone the installation of new equipment. You will certainly need to check over the settings on your chartplotter/GPS receiver. While it doesn’t happen all the time, simply installing new equipment can change the setting of other connected equipment, especially in this day and age of smart systems designed to be helpful.
I have noticed one thing a lot of people get confused with, is the measurement on the GPS receiver display of elevation. You might notice the boat GPS receiver elevation display is -10 meters at the dock, at “sea level”. The -10 meters is a perfectly accurate ellipsoidal height and as you know the dock isn’t 10 meters under water (or you would have bigger issues than interpreting an elevation measurement). So, although your GPS receiver’s ellipsoidal reading is accurate, it doesn’t seem to make sense unless you understand what it is. The reason for the measurement is that the real earth surface is not a perfect smooth ellipsoid and as mentioned earlier, it does have a lot of flat spots. It also has mountains, craters, and other features above or below that mathematically perfect smooth ellipsoidal that is the reference E.g. WGS84. The measurement you are seeing is more than likely because the patch of ocean your boat is floating in is on one of those flat spots as mentioned earlier. Keep in mind that this measurement is not used for tidal height even though it is a vertical measurement from the ellipsoid datum.
Vertical Datum AKA Tidal Datum
Tidal Datum is the water level that depths displayed on a nautical chart are measured from. Chart tidal datum is a vertical datum and not easy to confuse with the horizontal datum for the chart e.g. WGS84. A chart vertical datum is generally derived from some phase of the tide.
The most common chart tidal datum is LAT (lowest astronomical tide). Lowest Astronomical Tide, LAT for short is defined as the lowest tide level which can be predicted to occur under average meteorological conditions and under any combination of astronomical conditions. Many national charting agencies, including the Australian Hydrographic Service, use LAT to define chart datum.
 |
| Information box on paper chart, Chart Datum for horizontal WGS 84 and vertical reference LAT are defined. |
 |
| Chart information box, the satellite position WGS datum for applying corrections is not completely defined, its a real possibility of it being WGS 72. The good thing is the chart datum is listed as AGD 66. The Datum for tide depths are referenced to Indian spring low water. Cross referencing to the newer format of LAT may not be straight forward. |
One advantage of using LAT for chart datum is that all predicted tidal heights must then be positive (or zero) avoiding possible ambiguity and the need to explicitly state sign. Calculation of the LAT only allows for gravitational effects so in practice lower tides may occur due to other factors (e.g. meteorological effects such as high pressure systems). Charts show sounding in several ways, numbers denote individual soundings. These are supplemented by depth contours, lines connecting points of equal depth. These lines are used to present a picture of the bottom.
 |
| A tidal prediction harmonic, as can be seen here the lowest tide of the day is still a positive number above tide datum. A numeric tide table in the top right corner make it easier to get the times correct. |
Charts and tables
Charted depths and drying heights on nautical charts are given relative to chart datum. Some height values on charts, such as vertical clearances under bridges or overhead wires, may be referenced to a different vertical datum, such as mean high water springs or highest astronomical tide (HAT) (for "HAT" see tidal range).
 |
| Most charts define the reference of the height of the vertical clearances under bridges or overhead wires in the info box list . Its good to see the clearance listed on the bridge as well. |
Tide tables give the height of the tide above a chart datum making it feasible to calculate the depth of water at a given point and at a given time by adding the charted depth to the height of the tide. One may calculate whether an area that dries is under water by subtracting the drying height from the [given] height calculated from the tide table.
Tide table example
 |
| What has been known to happen when you get it wrong. |
 |
| A simple diagram showing tidal datum (black line) measurements of tide are referenced from the Datum. |
Other defining terms.
Mean Sea Level (MSL) Long term average of the level of the sea, this is continually changing or evolving as more data is collected.
Mean Low Water Springs (MLWS) Long term average of the heights of low water at full and new moon.
Mean Low Water Neaps (MLWN) Long term average of the heights of low water at the first and third quarters of the moon.
Mean High Water Springs (MHWS) Long term average of the heights of high water at full and new moon.
Mean Low Water Springs (MHWN) Long term average of the heights of low water at the first and third quarters of the moon.
Highest Astronomical Tide, HAT, Calculation of the HAT only allows for gravitational effects so higher or lower tides may occur due to other factors e.g. meteorological effects such as high or low pressure systems or storm cells. It is used, among other things as a datum from which to measure navigational clearance, or air draft, under bridges, power lines.
Using charts and tables not based on the same geodetic datum can result in incorrect calculation of water depths.
So there can be errors creeping into chart vertical datum, if the conversion from one datum to another is not carefully controlled, the soundings can be changed. The same can be said for changes from metric to imperial or vice versa.
Wow, another great post!
ReplyDelete