
There are times when the amount of data on the OpenCPN charts can cause a visual overload which can make it hard to see the information you want. For example when your planning to go into a new port all that chart text and details can make it hard to see where you actually need to go.
There are several 'hotkeys' that can be used to quickly remove data. These 'hotkeys' remove the need to fumble through the several layers of settings menus to find the switch to turn on or off the needed function.
A ‘hotkey’ is in this instance is the capital letter listed to toggle the function:
So if ‘caps lock’ is off press the ‘shift’ key and the required letter. E.g shift V
To reduce the amount of clutter on the chart quickly.
A toggle bottom features, turning it on is useful when anchoring. E.g sand, rock, mud
D open/close the charts zoom/scale weighting or detail slider.
O toggle Chart Outlines.
S toggle Soundings
T toggle Text
V toggle All nav objects (user data Waypoints etc) except Active route & track,
Keep in mind if you select hotkey T to clear text, the bottom hotkey A detail also is hidden.
See the screen captures below for a visual of how the different hotkeys effect the chart
Nice to know Hot Keys
I haven't included screen captures but if your interested experiment.
OpenCPN Manual Keyboard Shortcuts
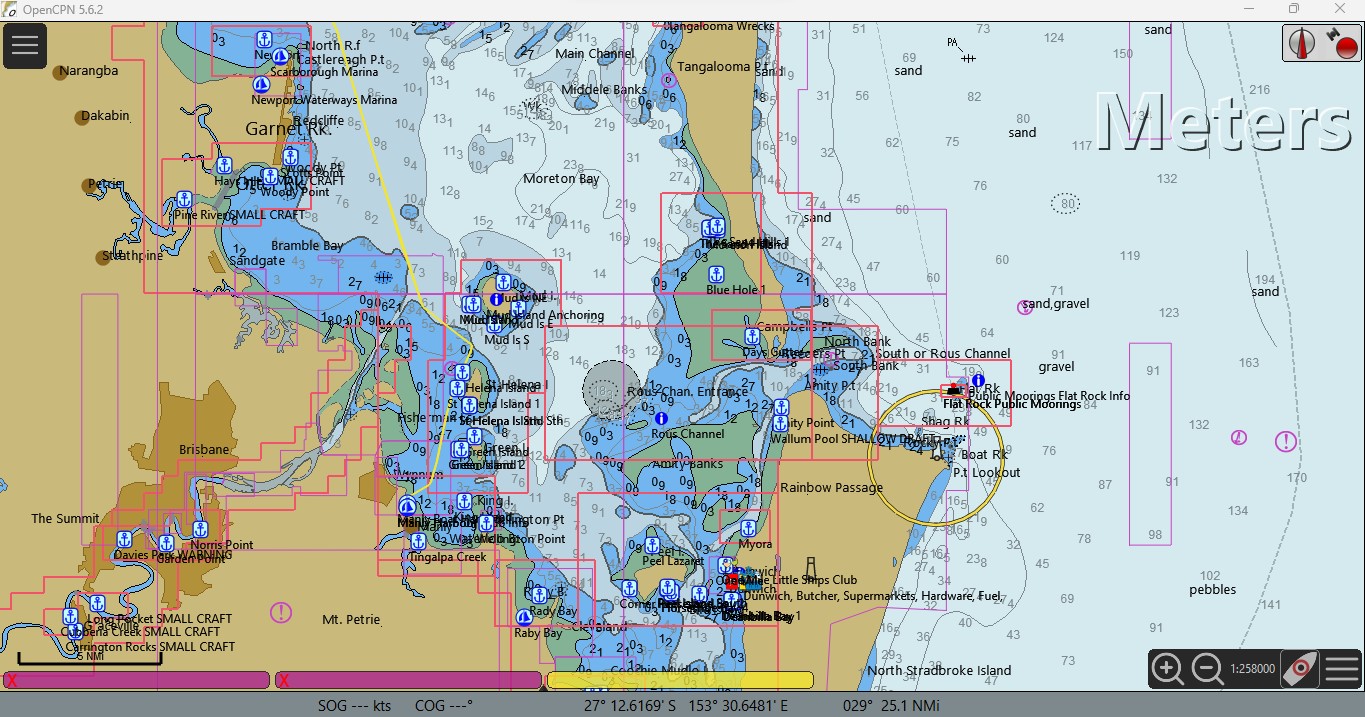 |
| A fairly standard chart, there are some areas in the world where there is certainly a lot more clutter, however rather than go looking for some, this should give some idea of what happens. As can be seen here waypoints and a track, bottom description, soundings and chart text, and the edges of addition charts are displayed. |
 |
| Use the V hotkey to remove the user created data in this case the waypoints and track data has been hidden. |
 |
| Use the O hotkey to remove the chart outlines shown in red in the previous screen shot, this helps remove some clutter. |
 |
| Use the S hotkey to remove the sounding information |
 |
| Use the A to remove bottom detail, its easier to see the detail has gone from the chart east of the islands. |
 |
| Use the T hotkey to remove text, place names and general text, as can be seen here the level of clutter has been greatly reduced |
 |
| Hotkey D to open a slider to increase detail or remove chart detail. |
 |
| The screen shot of the detail turned down, No hotkey just adjust the slider to the desired level of detail clutter, this can be used for short or long term, select a level you are happy with and feel safe when using. |
 |
| This is a screen shot of the detail slider set to the max level of detail. |
No comments:
Post a Comment